Usage
A general workflow using ENCORE would look like this:
1. Execute ENCORE
Once you have ENCORE installed in your system, run:
encore
You can also use:
python -m encore
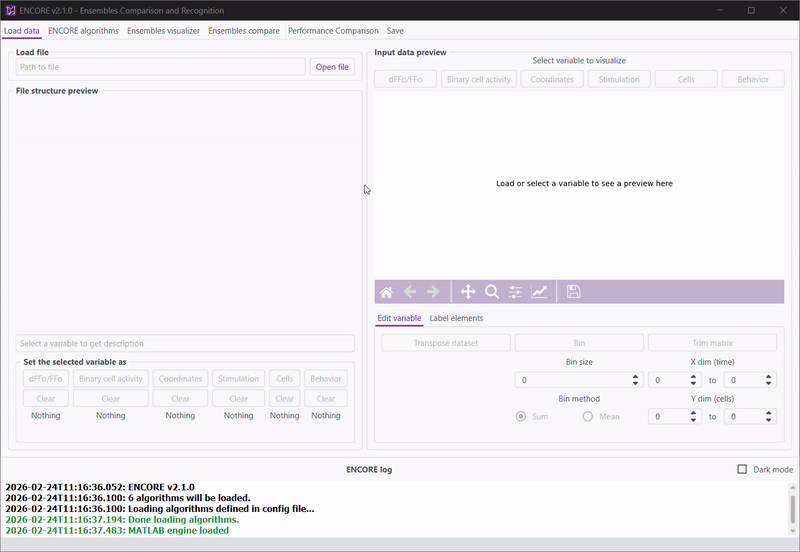
2. Load Your Data
Navigate to the “Load data” tab.
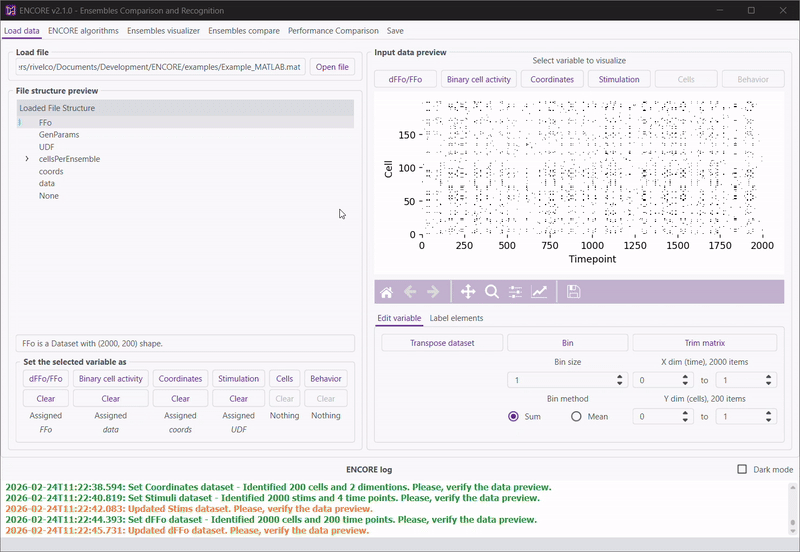
Click “Open file” and select your data file.
Use the “File structure preview” panel to locate the variable you wish to load.
In the “Set the selected variable as” panel, select the variable name to assign it.
Preview the data in the “Input data preview” panel.
If needed, modify the loaded variable using the “Edit variable” panel.
Optionally, assign labels to the variable’s elements.
Repeat this process until all necessary variables are loaded.
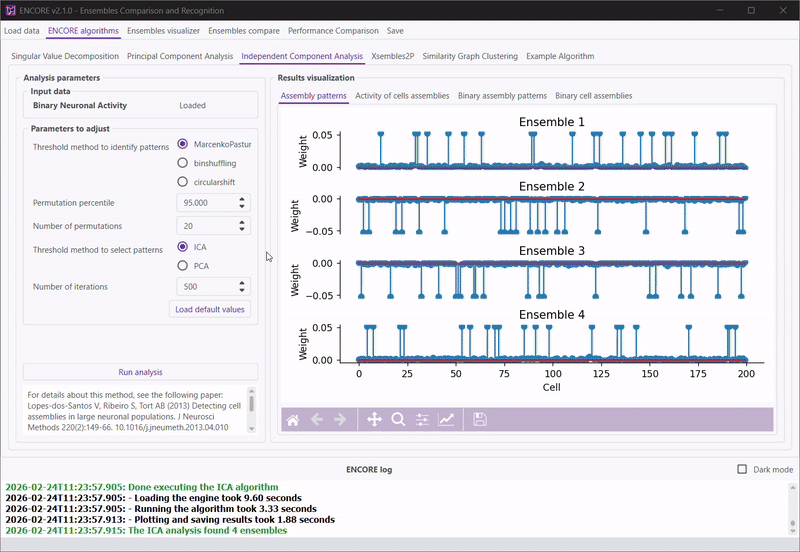
3. Run Analyses
Open any analysis tab, such as SVD, PCA, ICA, Xsembles2P, or SGC in the “ENCORE Algorithms” tab.
Ensure the “Input data” panel shows “Loaded” for the required data. If not, return to step 2.
Use the “Load default values” button to explore the analysis or adjust parameters as needed.
Click “Run analysis” to begin.
Monitor the “Console log” panel and the terminal for additional information.
Review the plots and adjust parameters as needed. Refer to the cited papers in each analysis tab for further understanding.
Repeat this process for each analysis.
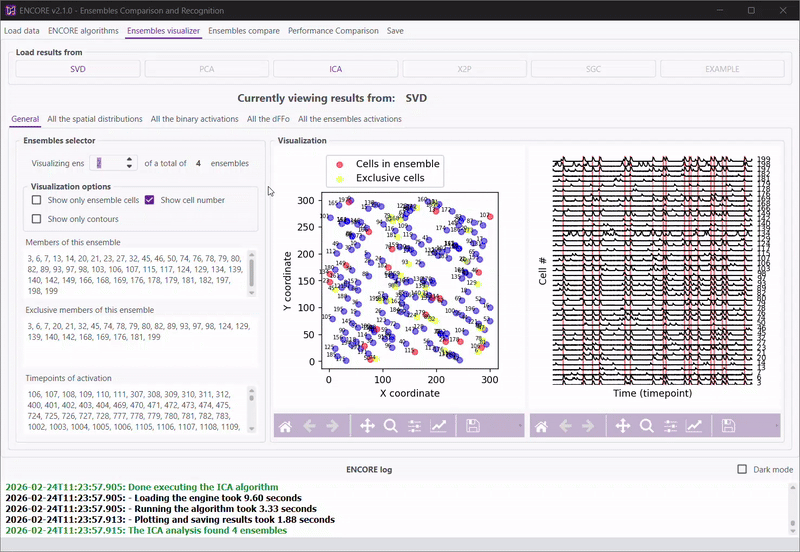
4. Visualize Results
Go to the “Ensembles visualizer” tab.
Click on the name of the analysis you wish to review. Only completed analyses will be clickable.
Explore the spatial distributions of neurons and the dFFo signal (if available).
Use the slider in the “General” tab to select ensembles for visualization.
Examine all visualizations, including the spatial distributions of recorded cells, their activations, and identified ensembles.
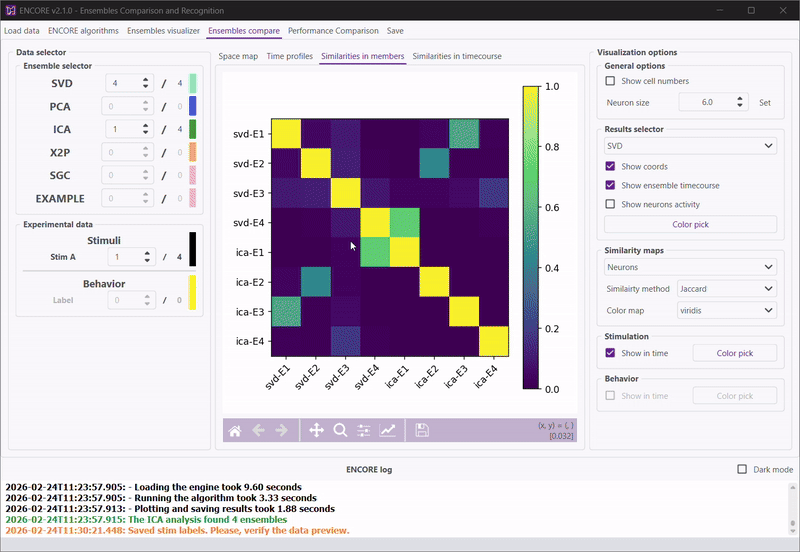
5. Compare Results
Open the “Ensemble compare” tab.
Use the “Similarities in members” or “Similarities in timecourses” tabs to identify similar results across algorithms.
Adjust the sliders on the left to select ensembles for each algorithm.
Optionally, filter by stimuli or behavior.
Explore the “Space map” and “Time profiles” tabs to compare selected ensembles.
Customize visualizations using the “Visualization options” panel.
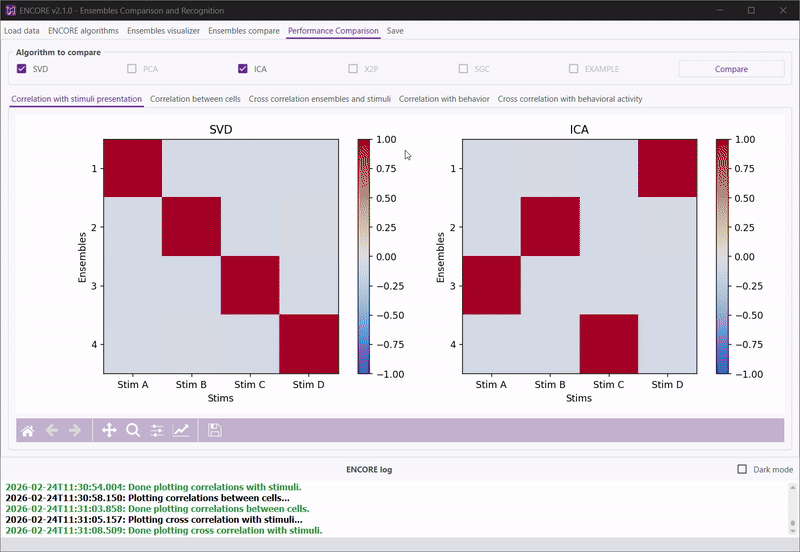
6. Evaluate Algorithm Performance
Go to the “Performance Comparison” tab.
If stimuli or behavior data are loaded, view performance comparisons. Missing data will be indicated in the plots.
Check the “Correlation between cells” tab to view correlations within ensembles.
Select the most suitable analysis or adjust parameters as needed.
7. Save Results
Open the “Save” tab.
- Choose the data to save:
Minimal results used by ENCORE: Three matrices for each algorithm—neuron membership in ensembles, ensemble activation, and the total number of ensembles.
Full results of every analysis: Includes additional data used by the original algorithms.
Select the desired export format.
Additional Tips
Hover over any option or button to view tooltips with detailed explanations.
Save plots using the “Save” icon below each figure.
Interact with visualizations by moving or zooming with the cursor.
Plots will display helpful messages if additional data or analyses are required.
Check the “ENCORE log” panel and Python console for additional information during analysis.